Plot. Draw. Label.
S5 Plot. A deed plotting app that stays out of your way. Plot deed descriptions, then modify them by drawing roads, easements, waterway and more. Then label your drawings or other noteworthy features.
S5 Plot. A deed plotting app that stays out of your way. Plot deed descriptions, then modify them by drawing roads, easements, waterway and more. Then label your drawings or other noteworthy features.
This gives you the opportunity to check out the program without buying it. It is recommended for the best experience to use Google Chrome for the trial.
Need help getting started? These tutorials should help you get started plotting deeds in no time.
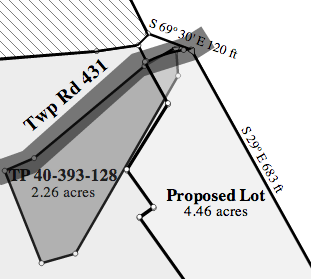
It's important to plot many parcels to see how they fit together. S5 Plot makes it easy to plot, move, and scale to compare many different parcels on the same document. Color them different, apply patterns, and add transparency to make them stand out.
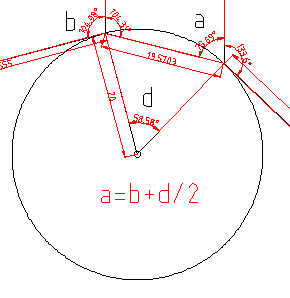
Curves can be a tricky thing when plotting deeds. S5 Plot makes it easier to plot curves. With the ability to type in your own chord angle, have it be tangent to the line before or after it, you will be mastering curves in no time. And the curves will look gorgeous, too.

S5 Plot is a Chrome app. This means it will run on any operating system that supports Google Chrome's™ webstore. That could be your Mac, PC, or GNU/Linux box. It also means it act like an app, not a website. With S5 Plot you can save and open files, just like you would in with any normal application on your computer. Files are saved as an SVG file which means you can share them with other people to view who don't have S5 Plot.
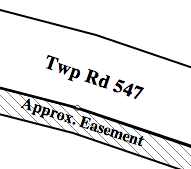
With S5 Plot you can draw roads, streets and waterways and then label them! Label where relevant streets are on your plot and then draw them. With many different options for drawing, it is easy to draw roads, waterways and many more things. Drawings and labels will scale with you plot, too.
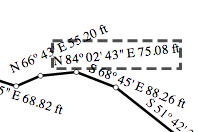
If you can see it you can move it. Often times the labels for calls will get jumbled up because they are so close together. With S5 Plot you can move these call, name, and area labels where you want to make your plot look the best it can look. Of course if you are hopelessly out numbered you can just hide them. Future release will support automatic numbering of calls in a table.
This tutorial will help you get started plotting deeds on S5 Plot.
Side Note: These screenshots are for an older version, but the core functionality is the same. I'll updated them in a few weeks (as of 10/18/2013) when I get some time.
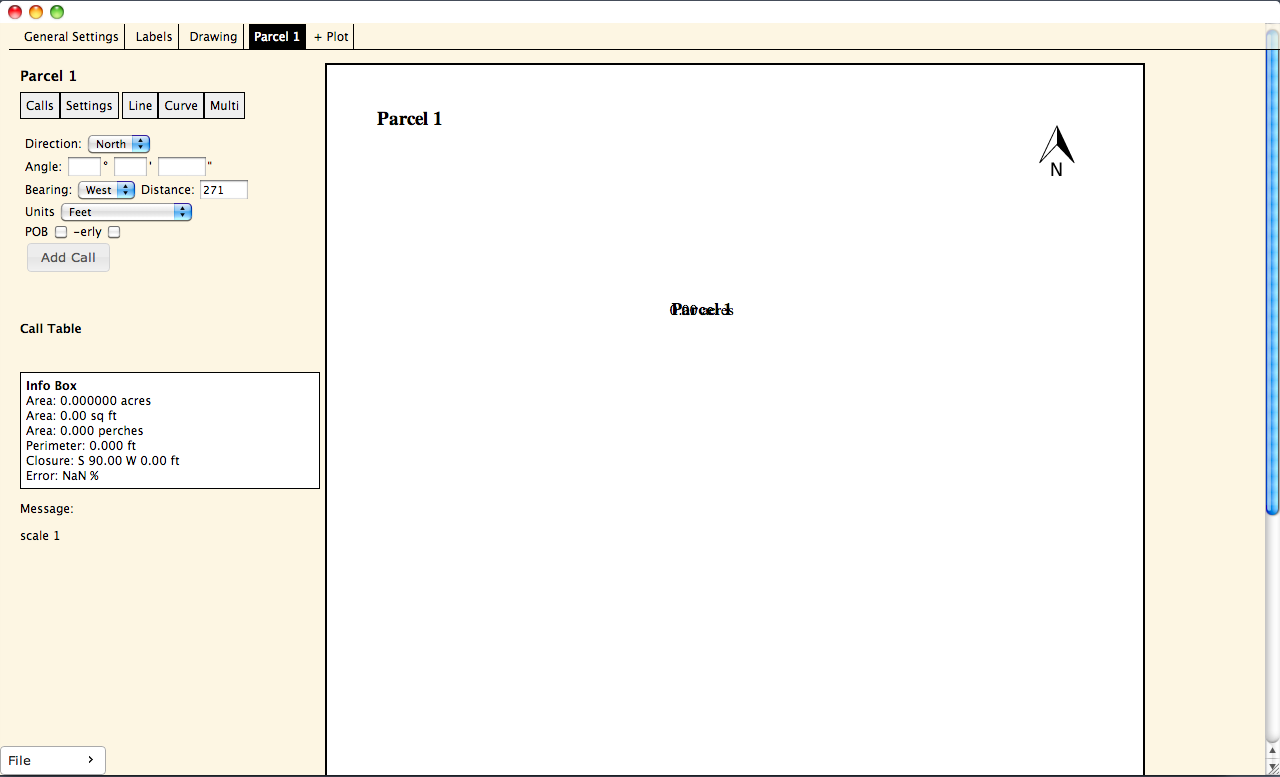
The default layout of S5 Plot will look something like this:
A typical deed description may look somethings like this:
BEGINNING at a point on the north line of Kramer Court, said point being one hundred fifty-four and four tenths (154.4) feet westerly from the west line of Elmira Street; thence north eighty-one (81) degrees twenty (20) minutes west along the north line of Kramer Court, a distance of twelve and nineteen hundredths (12.19) feet to a pipe; thence north eight (08) degrees forty (40) minutes east along grantees, a distance of twenty-five (25) feet to a pipe; thence south eighty-one (81) twenty (20) minutes east along the same, a distance of twelve and nineteen hundredths (12.19) feet to a steel post; thence south eight (08) degrees forty (40) minutes west along grantors, a distance of twenty-five (25) feet to an iron pin, the point and place of beginning;
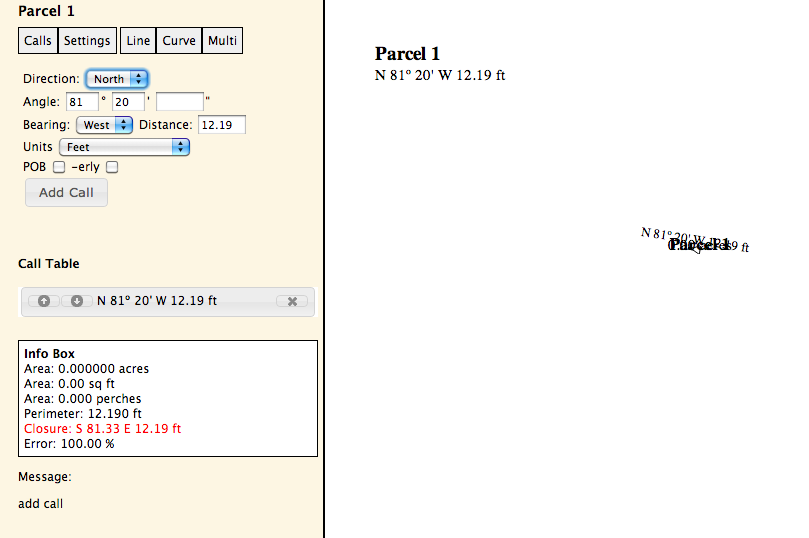
To start plotting, input the call direction, angle, bearing, distance and units in the line input form of parcel 1 and click add call or push enter. Notice the degrees and minutes are separated by a colon. The result should look like this:
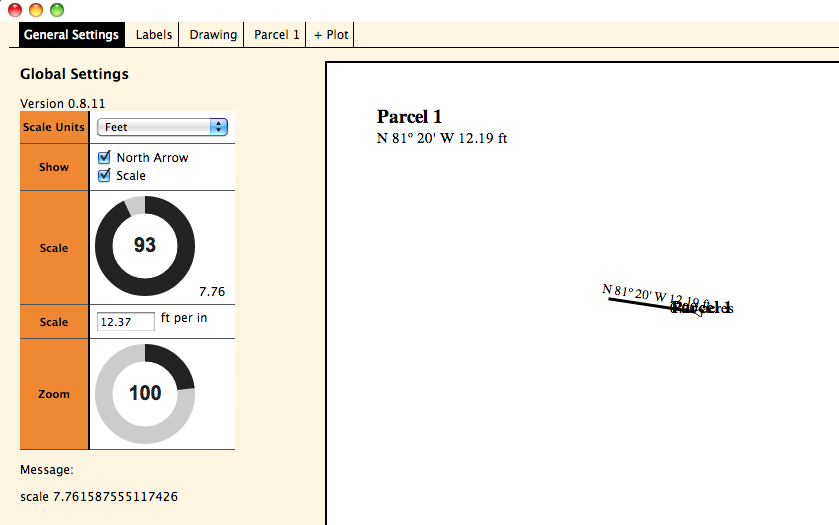
The line is not very visible. To see it better the plot will need to be scaled. Click on the general settings tab at the top left corner of the page. There are two knobs, rotate the scale knob clock-wise to increase the size of the plot. Since this plot is pretty small, it will need to be scaled at 99 or 100. (You can also type a desired scale in the input box below the scale knob in the unit of feet per inch.) The result should look like this:
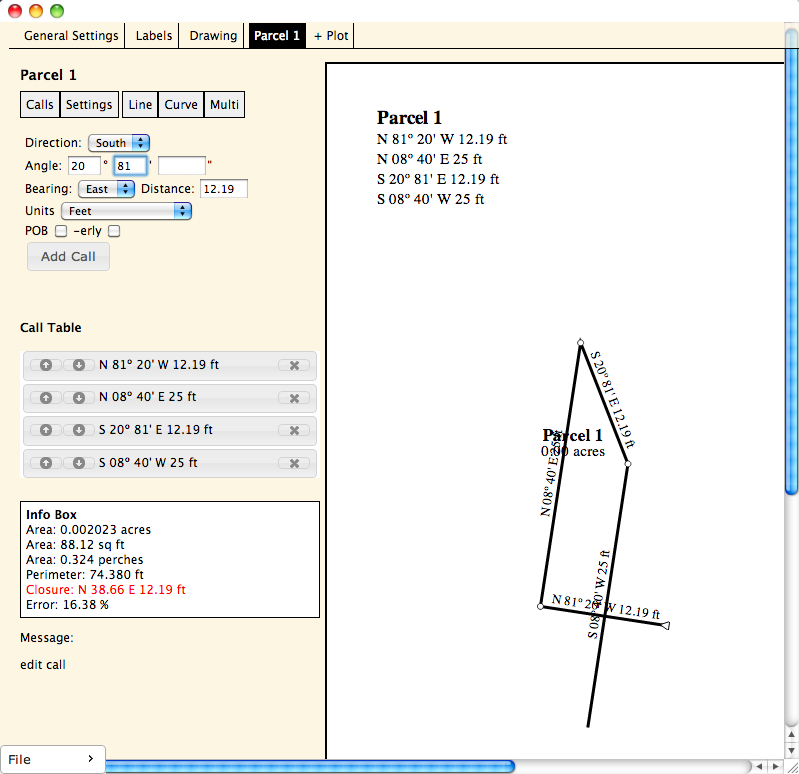
To continue to input calls on the plot, click on the Parcel 1 tab. Continue to enter in the rest of the calls. The end result should look similar this (there is a call incorrectly entered intentionally):
Part of the plot is off of the drawing canvas. To see the whole plot click on it and drag it to roughly the center of the canvas. Be sure not to click on any of the text around the plot, because then the text will be moved and not the plot.
The example given has a call incorrectly inputed - it's the third call down on the list. It is S 20° 81" E 12.19 and should be S 81° 20" E 12.19 ft. To correct it, click on the incorrect call on the call table on the right side of the page. When it is click, the add call button will disappear, and an edit and cancel button will appear in it's place.
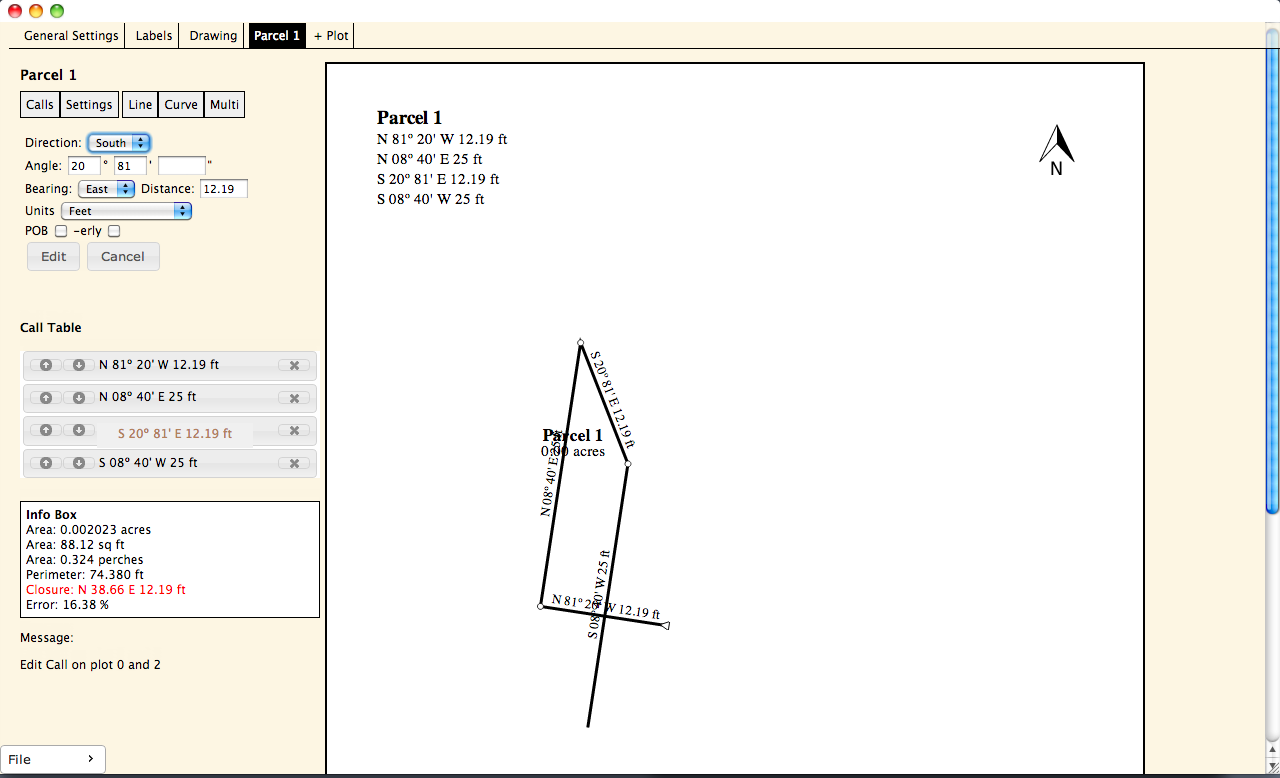
Type the correct angle inside the angle input box then click edit. The plot should now be corrected.
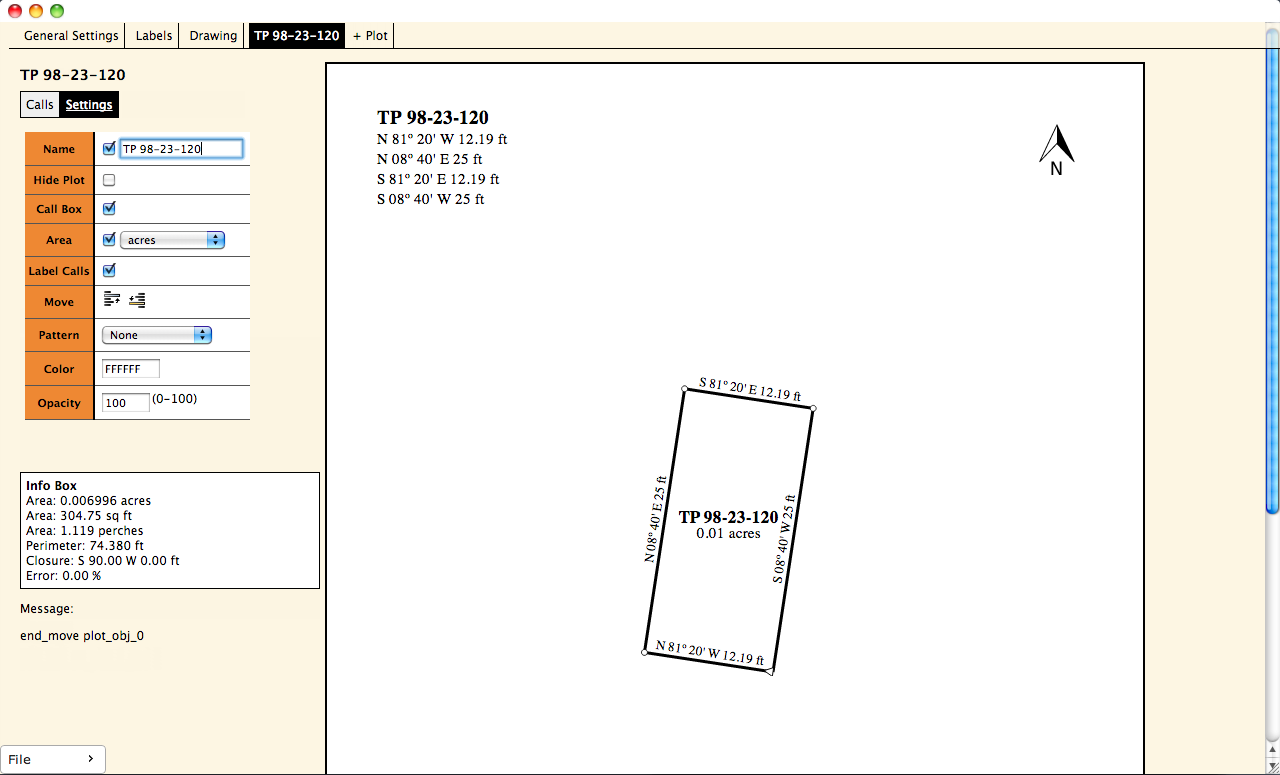
To change the name of the plot from Parcel 1 to a more descriptive name, click on the settings span below the Parcel 1 heading. The call inputs and table will disappear and the settings form will show. These are the settings for Parcel 1 and only for Parcel 1. The first input box is Name. Simply start typing the name and it will change automatically. Notice the tab, the header and the call box header all change with when the name input is changed. Also, the acage on this piece is 0.01 acres, which isn't very descriptive. To switch the display area to square feet click on the select box that says acres, pick sq ft and THEN click somewhere outside the select box for the changes to take affect.
If there was another parcel on this deed or an exception, it could be plotted with this one by clicking on the + Plot tab.
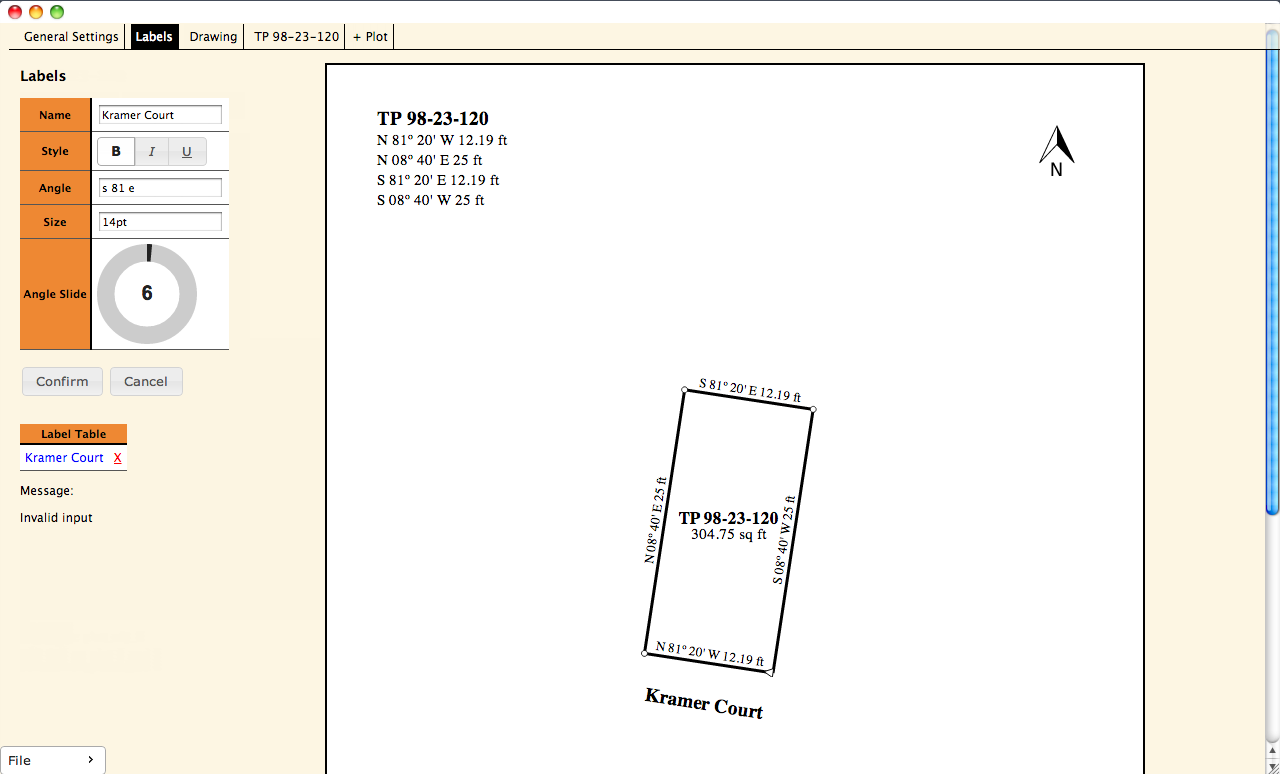
Labels can be added to the plot to describe the land around it. Kramer Court is an alley that borders this plot. To add it, click on the label tab, type Kramer Court, then click add. Click and drag to move it to the southern boundary of the plot. To rotate it, click on "Kramer Court" in the label table on the left, then use the knob to rotate it to the orientation desired. Or to rotate you can type in the angle input box an angle in call form, for example s 81 e. (usually degrees are enough, but if more precision is needed, separate degrees, minutes, and seconds by a colon, ex S 81:20 E. Also capital letters or lower case letters doesn't matter, ex. 'n' and 'N' mean the same thing). Any call angle that ends in west will be upside down, you may have to switch for example N 80 W to S 80 E. Then click "Confirm" to save the changes.
To add more labels, type the name desired in the name input box and click add. Be sure the confirm and cancel buttons are not visible, as one of the current labels will be changed instead of adding a new on.
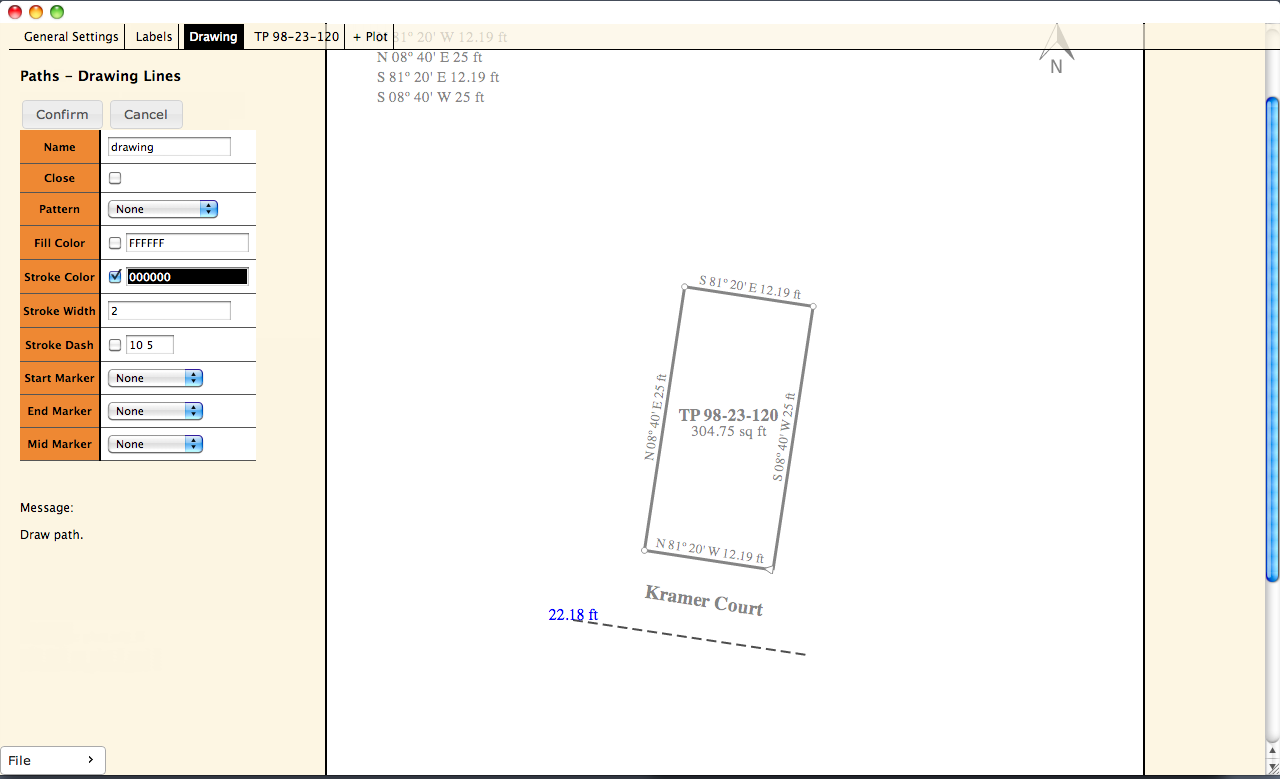
To draw the boundary of the road click on the drawing tab and press add (or push 'd' on the key board). The drawing canvas will gray, then click where you would like the first point of the road to be. Then click where you would like your second point to be. You can go on if need be. This also doubles as a measuring tool. After you click you first point the distance from the first point and where you cursor is located is given by your cursor. When done drawing push confirm, or enter on you keyboard, or 'd' on your keyboard.
To save the plot, click on the file button on the lower left corner of the screen. This will bring up a menu, push save, then your system dialog will come up and you can navigate to where you desire to save your plot. The plot is saved as an SVG file. This is so others can view the plot on a modern web browser without having this program. The actual plot data is embedded in the file.
To open a plot, click on the file button, then open. Then you can open an svg file that was created by this program. If the svg file was not made by this software than it cannot be opened.
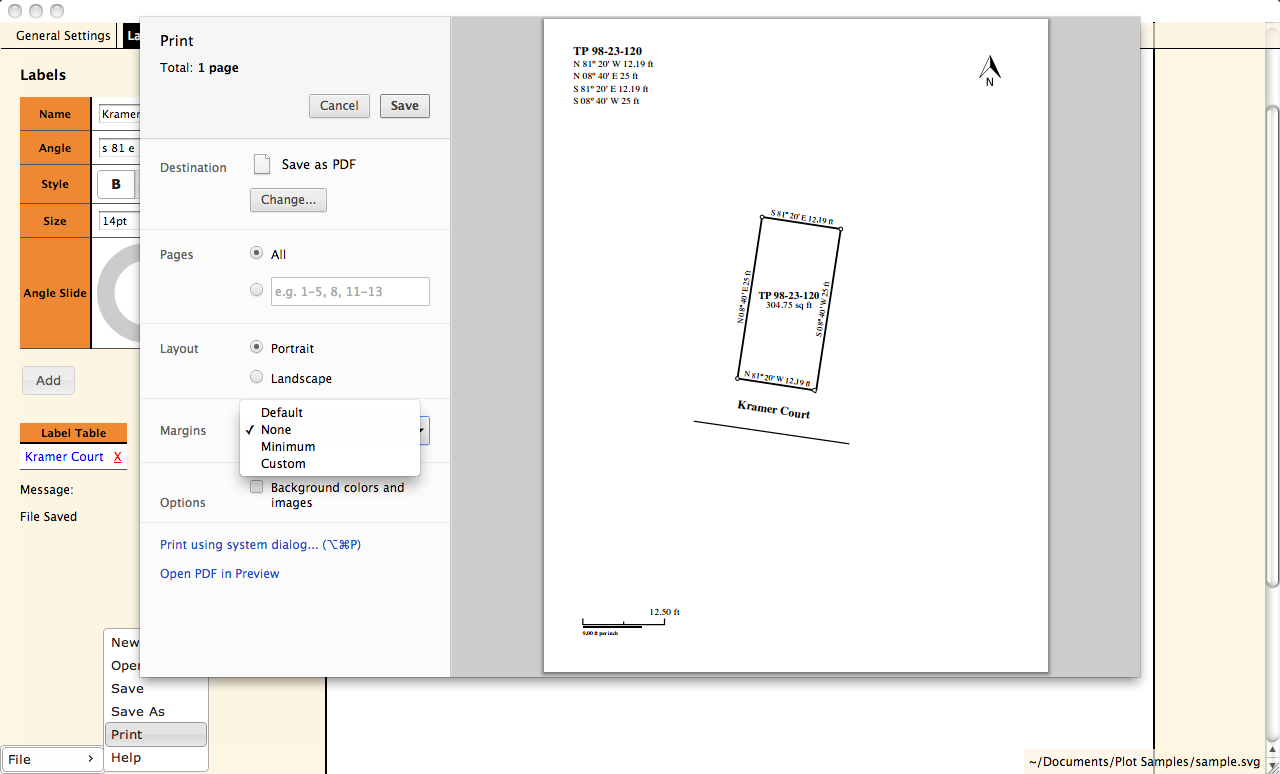
To print your plot, click on the file button, then print. Or push 'p' on the keyboard. Chrome's print dialog should come up. For the scale to be accurate in terms of ft per inch on the printed paper make sure the margins are set to "None".
Hopefully that will get you started plotting deeds.
This will cover some things not covered in the tutoral above. Also, try exploring the program by trying to see how things work on a document copy that isn't very important.
To enter a point of beginning, click the check box labeled POB when entering calls. If you entered a call that as a POB, but want it to be a regular call, click on it from the call list, uncheck the POB box, and click the edit button. The call will then be added last to the list of the regugar calls then.
To move a call, click and drag it from the list to where you want it. Or you can click the up and down arrows to the left of the call in the list.
Sometimes on deeds, an angle for the call is not given instead the call may be written like this, Westerly 340 feet. To make the angle display like that, input an angle (like North 90° West 120 ft) then check the -erly box. The angle displayed on the plot will be "Westerly 120 ft".
Typicaly to plot curves, you need the direction, radius, arc length, and chord angle. If a chord angle is not supplied and there is only one curve in the plot, then you can skip the curve, continue plotting, then use the Closure angle in the info box to supply a chord angle for the curves. Then click and drag the call angle in the angle list to its correct spot in the plot.
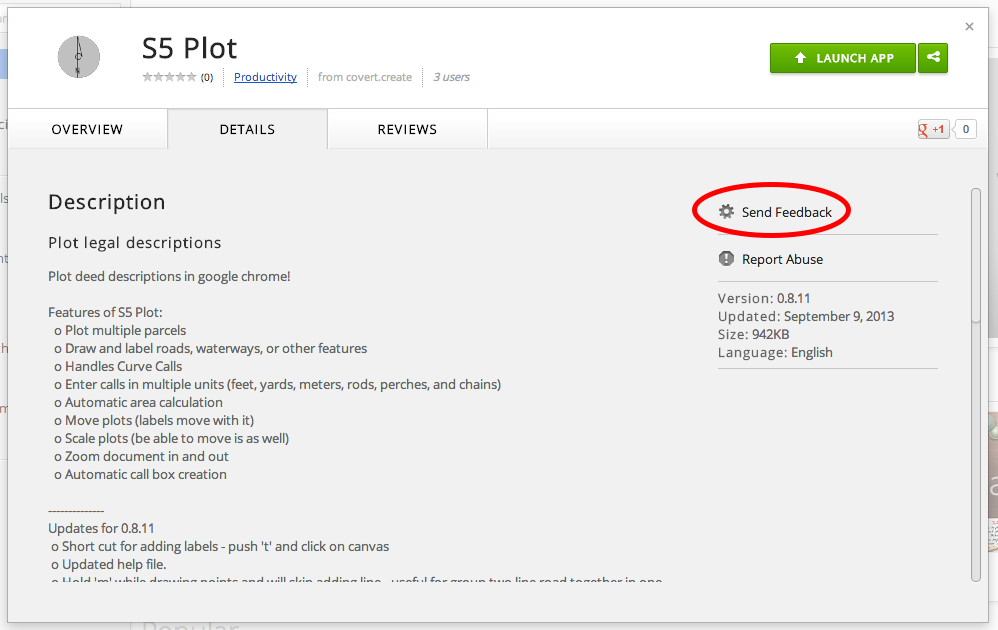
For questions, bugs, or feature requests use the feedback button on the Chrome Webstore™.
S5 plot was created by Bill Covert. Bill works as a title searcher in his local county. After being disatisfied with the existing plotting progams for Mac, he set out to make his own cross platfrom plotting program to overcome some of the limitations of current programs on the market.